|
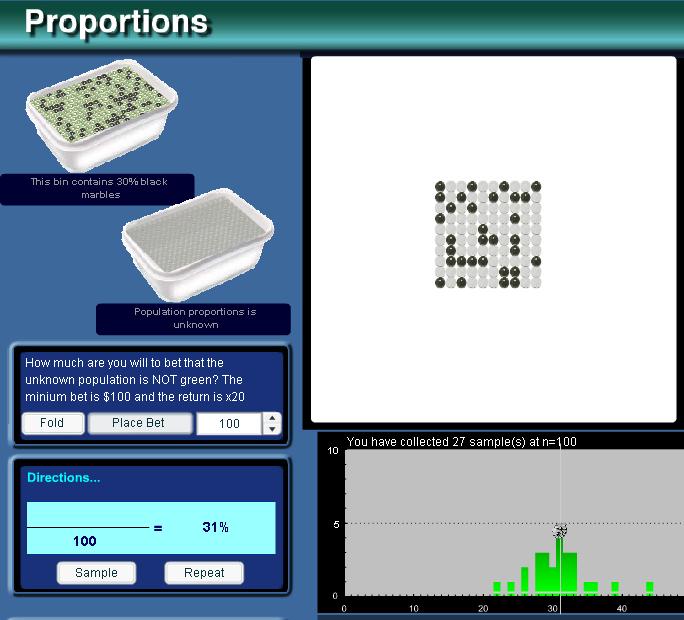
Working with Proportions
Learn how proportions behave and how to make statistical decision with proportions. |
 |
|
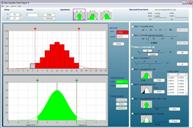
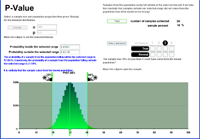
Sampling Distribution of Proportions
Build your own sampling distribution by scooping marbles from a bin then compare and test your results! |
 |
|
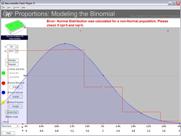
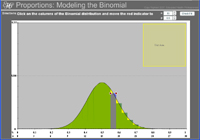
Probability and Binomial Distribution
Compare the Binomial Distrbution and your sampling distribution of proportions and use on-screen calipers to calculate the probability inside of a selected range. |
 |
|
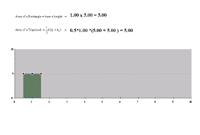
Area Under the Bar
Change the height and shape of this bar and watch Flash calculate the area under it. |
 |
|
Approximating the Binomial Distribution I
Adjust the shape of the Binomial Distribution to see if the Normal (Bell-shaped) Curve is a good fit. |
|
|
Approximating the Binomial Distribution II
See when the Normal distribution is a good fit and when the Poisson distribution is a good fit for the Binomial distribution |
|
|
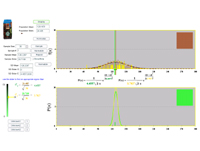
z-statistic
see how the binomal can be translated to the normal distribution and calculate z-statistics. |
Working with Means
See how populations and sample means behave and learn how to make inferences. |
 |
|
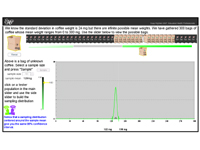
Sampling Distribution of Means
Take scoops of coffee out of the bag to build your own sampling distribution of means and test a unknown scoop against what you build.
If it falls out it's unlike to be the same. |
 |
|
Understanding Confidence Intervals
If you have a scoop of coffee and it's mean weight, how do you decide whicj bag of coffee it came from? |
|
|
Error and Confidence Intervals: Known Sigma
Solidify your understanding of C.I.s by building C.I. and see if and how often it works when it's based on a known population sigma..
|
| |
|
Error and Confidence Intervals: Unknown Sigma
Solidify your understanding of C.I.s by building C.I. and see if and how often it works when it's based on a sample standard deviation.
|
| |
|
Making Decisions with z-statitstic
Solidify your understanding of C.I.s by building C.I. and see if and how often it works when it's based on a sample standard deviation.
|
| |
|
Making Decisions with t-statistic
Solidify your understanding of C.I.s by building C.I. and see if and how often it works when it's based on a sample standard deviation.
|
 |
|
Application: student score
How do you tell is a school is underforming or if it's variation in the sampling of means? |
Working with Difference of Proportions
Learn how to make decision when you have the difference of two proportions. |
| |
|
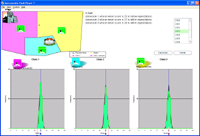
Sampling Distribution of Difference of Proportions
Build your own samplgin distribution by scooping from two bins of marbles and record the difference of proportions.
|
| |
|
Clinical Data: Vioxx
Visualize the Vioxx clinical trial data by putting the points against the expecting sampling distribution of means.
Does it fall outside?
|
Working with Probabilities
learn the basic operation of working with probability and visualize fundamental theorems |
| |
|
Probability Operators
Use this tool to visualize and calculate 'and', 'or', 'not', and more
|
|
|
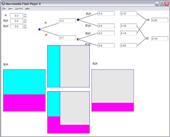
Conditional Probability
Need to relate one event in terms of another?
|
| |
|
Bayes Theorem
Need to relate one event in terms of another?
|
| |
|
DeMorgan's Theorem
Need to relate one event in terms of another?
|